
By the numbers8 min read
When UK shoppers spend: a calendar for promotional texts
ONS figures put December 2025 retail sales value 37% above January's, with online at 32.4% of sales in November. The shopping year, month by month, for texts.
In short
- ONS figures show the value of retail sales in Great Britain was 37% higher in December 2025 than in January 2025, before seasonal adjustment.
- Internet sales were 32.4% of all retail sales in Great Britain in November 2025 on the ONS series J4MC, the highest month since November 2021.
- Black Friday fell on 28 November 2025, inside the ONS November reporting period, and retail sales volumes rose 11.9% over the month before seasonal adjustment.
- When Black Friday fell in the ONS December period in 2024, December volumes rose 9.4% before seasonal adjustment, the largest December rise from 2021 to 2024.
- The ONS found that 87% of adults in Great Britain planned Christmas purchases in November 2025, and 41% of those planned to buy gifts earlier to spread the cost.
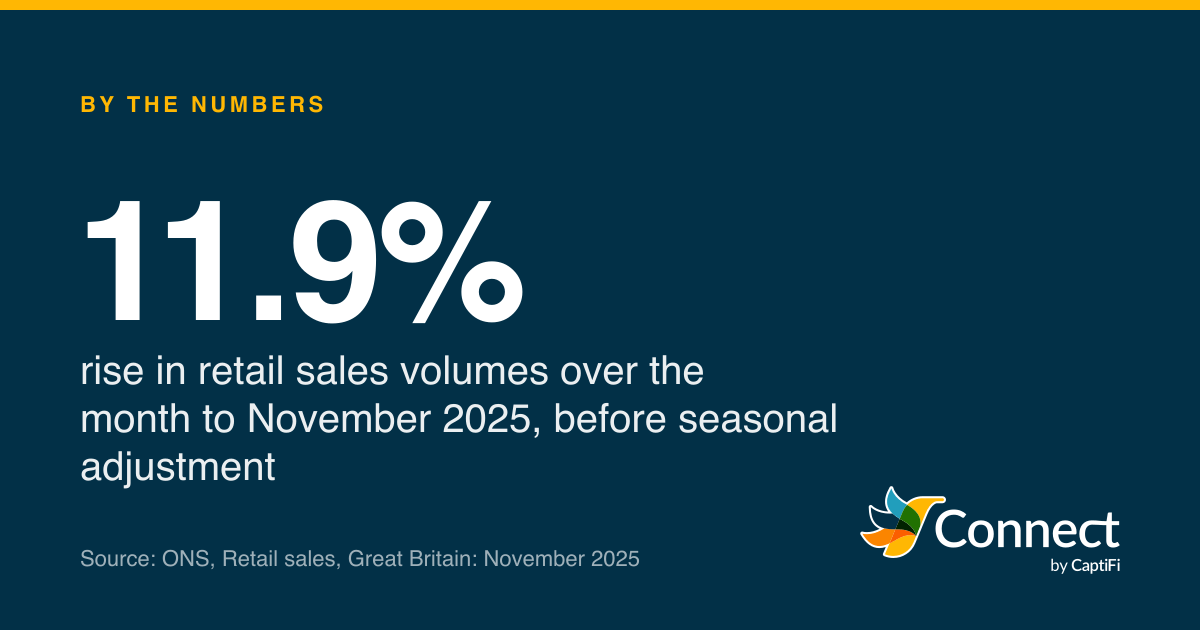
11.9%: rise in retail sales volumes over the month to November 2025, before seasonal adjustment. Source: ONS, Retail sales, Great Britain: November 2025.
Retail sales in Great Britain have one big peak, and it starts before Christmas. The Office for National Statistics' index of retail sales values for Great Britain, not seasonally adjusted, rose from 90.3 in January 2025 to 118.0 in November and 123.8 in December (2024 = 100), so December's sales value was 37% above January's. Online peaks a month before the shops do: internet sales were 32.4% of all retail sales in November 2025, the highest month since November 2021. And the ONS's November 2025 bulletin, published on 19 December 2025, put the jump in sales volumes over the month at 11.9% before seasonal adjustment, which it described as "a fairly typical Black Friday effect".
For anyone sending promotional texts, those numbers make a rough calendar of when people are already spending, when more of it happens online, and which months are quiet.
What the monthly figures show
The series that shows the shape most plainly is J43S in the ONS Retail Sales Index: the value of sales by all retailers except fuel stations, at current prices, before any adjustment for the time of year. The latest release, on 18 September 2026, carries it to August 2026.
- 2024
- 2025
All retailers excluding fuel, value index at current prices, by ONS reporting period. Values include price rises, so 2025 sits above 2024 partly for that reason.
Source: ONS, time series J43S, Retail Sales Index, released 18 September 2026
See the figures as a table
| 2024 | 2025 | |
|---|---|---|
| Jan | 89.5 | 90.3 |
| Feb | 92.2 | 94.2 |
| Mar | 96.2 | 98.1 |
| Apr | 94.1 | 101.5 |
| May | 100.5 | 100.5 |
| Jun | 97 | 100.3 |
| Jul | 99.9 | 103.3 |
| Aug | 96.7 | 99.8 |
| Sep | 95.9 | 100.2 |
| Oct | 100.4 | 105.5 |
| Nov | 110.9 | 118 |
| Dec | 123.5 | 123.8 |
January is the low point every year (89.5 in 2024, 90.3 in 2025). Sales climb through the spring, sit between about 96 and 103 from May to September, and then rise from October. In 2025 October reached 105.5, November 118.0 and December 123.8. Because these are values, a share of the rise from one year to the next is just prices going up, which is why the 2025 line sits above 2024 almost everywhere. The seasonal shape is the part to look at, and it barely changes.
The one month where the two years part company is November: 110.9 in 2024 against 118.0 in 2025. The ONS's explanation is the calendar.
Black Friday and the ONS calendar
The ONS doesn't count retail sales by calendar month. It uses reporting periods of four or five weeks, and whether Black Friday lands in its November or its December depends on where those periods fall.
In 2025, the November bulletin says, "Black Friday took place on 28 November 2025. This fell within our November reporting period, which covers the four weeks from 2 November to 29 November 2025". In 2024 it didn't. Black Friday was on 29 November 2024, and the November 2024 period ran "four weeks from 27 October to 23 November 2024", so the day itself fell into a December period covering "five weeks from 24 November to 28 December 2024". The November 2024 bulletin adds that "some retailers reported that Black Friday sales started well in advance of the official day".
The ONS's November 2025 bulletin includes the raw monthly changes in sales volumes for the two months either side of Black Friday, before seasonal adjustment:
| Year | November | December | Black Friday fell in |
|---|---|---|---|
| 2021 | 11.7% | 4.2% | November period |
| 2022 | 10.1% | 6.4% | November period |
| 2023 | 13.3% | 2.4% | November period |
| 2024 | 9.1% | 9.4% | December period |
| 2025 | 11.9% | not in the bulletin | November period |
The table shows the difference. In 2021, 2022 and 2023, with Black Friday in the November period, November volumes rose 10% to 13% on the month and December added a smaller rise. In 2024, with Black Friday moved into December, the two months rose by almost the same amount, 9.1% and 9.4%. The ONS's own reading of November 2025 is that its 11.9% was "higher than in 2022, roughly in line with 2021, but below that of 2023". Its advice to users is to focus on the seasonally adjusted figures, which remove these effects; on that basis, volumes fell by 0.1% in November 2025.
The spending that gets labelled Black Friday is spread across late November, starts before the day, and sits right next to the start of Christmas shopping. A text sent in the third week of November isn't early.
Online's November
Which shops peak when
The total hides a lot of variety, and the ONS dataset behind the index breaks it down by type of store. Taking the same value indices for November and December 2025 (2024 = 100, not seasonally adjusted) shows three different shapes.
- November 2025
- December 2025
Value indices, not seasonally adjusted, series EAGE, EAFU, EAFW, J596, EAFV and EAFS. The ONS names the first group non-specialised non-food stores.
Source: ONS, Retail Sales Index dataset (drsi), released 18 September 2026
See the figures as a table
| November 2025 | December 2025 | |
|---|---|---|
| Department and variety stores | 135 | 147.7 |
| Clothing and footwear | 123.9 | 141 |
| Other non-food stores | 117.6 | 130.4 |
| Non-store, mostly online | 132.8 | 123.9 |
| Household goods | 122.7 | 100.9 |
| Food stores | 107.7 | 116.4 |
Department and variety stores, clothing and footwear shops and other non-food stores all peak in December, and steeply: clothing went from 81.1 in January 2025 to 141.0 in December. Non-store retailers, which the ONS says are mostly online, peak in November instead (132.8, falling to 123.9 in December), and so do household goods stores, whose December figure of 100.9 was about where they'd been in the summer. Food stores move least, from 95.5 in January to 116.4 in December.
So "the Christmas peak" means different weeks for different shops. A homeware shop is past its busiest month by the time a clothes shop reaches its own, and a promotional text timed for one would be early or late for the other.
Online's November
The ONS series J4MC gives internet sales as a share of all retail sales by month. It peaks in November every year: 31.3% in 2023, 30.3% in 2024 and 32.4% in 2025. December falls back (29.0% in 2024, 29.5% in 2025) as people go to the shops, and every other month since September 2023 has been between 25.5% and 28.7%. The November 2025 bulletin's own figure for the proportion of sales made online, in its section on seasonally adjusted values, was 28.6%; J4MC keeps the seasonal peak in.
That matters for texts with links in them. A promotional text in November reaches people at the point in the year when the largest share of spending happens online, and a tracked link will show you whether they did. Our post on retail texts covers the collection and back-in-stock texts that follow an online order, and the CMA's rules on "was" prices and limited-time claims, which matter most in this season.
What people planned for Christmas 2025
The ONS asks people about their plans through its Opinions and Lifestyle Survey, and in November 2025 (fieldwork from 5 to 30 November) it asked about Christmas. The results came out on 18 December 2025. Of adults in Great Britain, 87% planned to make Christmas purchases. Among those, 41% said they'd buy gifts earlier to spread the cost, 41% said they'd reduce their overall spending, 25% planned to use savings and 14% credit or payment plans. Around 38% agreed they'd spend more than the year before, rising to 55% of 16 to 29-year-olds.
Buying earlier to spread the cost is the finding that changes the calendar. If four in ten Christmas shoppers plan to start sooner, a gift offer that waits for December arrives after a chunk of the buying is done. October and early November are when that group is looking.
And payday?
Payday is the other date people point to, and here the official numbers are thin. The ONS publishes real-time indicators of card spending based on Revolut cardholder data, and its quality note says the figures "are not seasonally adjusted. This means daily, weekly and monthly patterns in spending have not been accounted for, such as the impact of paydays, retailer discounting, and bank holidays." So the ONS treats a payday pattern as something present in raw spending data. We didn't find an official series that puts a size on it, so there's no payday figure in this post. If your own sales jump at the end of the month, your own till data is the best guide to whether a payday text is worth it.
A calendar for promotional texts
Putting the ONS figures and GOV.UK's bank holiday list together gives a year that looks like this.
| When | What the figures show | What it suggests for texts |
|---|---|---|
| January | The lowest sales value of the year, 10% to 12% below the annual average in 2024 and 2025 | Fewer, sharper offers; a reason to come in |
| February to April | A steady climb; Easter 2027 is Good Friday 26 March to Easter Monday 29 March | Seasonal launches, Easter opening hours |
| May to September | A plateau around the annual average; bank holidays on 3 and 31 May 2027 | Events and new stock more than discounts |
| October | Sales start rising, and Christmas shoppers who plan to buy early are looking | Gift ideas, booking windows, early offers |
| November | The peak month online, with Black Friday spending through the second half | Offers with links, and a clear end date |
| December | The highest sales value; Christmas Day is Friday 25 December 2026, with the Boxing Day holiday on Monday 28 December | Opening hours, last order dates, collection times |
Two cautions apply all year. Every promotional text to an individual needs consent or the soft opt-in, and an opt-out; the SMS marketing rules guide covers both. And sale claims such as "ends Sunday" or "was £60" have to be true in any season; our post on prices in promotional texts explains what the CMA expects.
Frequency is the third thing to plan. Spacing offers across October and November, matched to when the figures say people are buying, gives each text its own reason to be sent.
Here's how that might look for a hypothetical gift shop in York that sells in store and online, with a list of customers who've agreed to texts. A gift guide on Tuesday 3 November, for the people who start early. A preview of its Black Friday offer on Thursday 19 November, with the end date in the text. The offer itself on Friday 27 November, from mid-morning. Then one practical text on Tuesday 15 December with the last day for online orders and the shop's Christmas opening hours, which is service information as much as marketing. Four texts across six weeks, each tied to something the figures say is happening.
CaptiFi Connect lets you write a campaign once and schedule it for the day it should go, with quiet hours so it never lands at night, and each campaign's tracked links count the clicks so you can see whether November earned its place. Black Friday 2026 is on Friday 27 November, and whether the ONS counts it in its November or December figures will depend on where this year's reporting periods fall.
Sources
Read for this post on 22 October 2026.
- ONS: RSI value, not seasonally adjusted, all retailers excluding fuel, time series J43S
- ONS: Internet sales as a percentage of total retail sales, time series J4MC
- ONS: Retail sales index dataset, all series (drsi)
- ONS: Retail sales, Great Britain: November 2025 (released 19 December 2025)
- ONS: Retail sales, Great Britain: November 2024 (released 20 December 2024)
- ONS: Retail sales, Great Britain: December 2024 (released 17 January 2025)
- ONS: Retail sales, Great Britain: August 2026 (released 18 September 2026)
- ONS: Public opinions and social trends, Great Britain: November 2025
- ONS: Using Revolut cardholder data to derive real-time indicators of consumer spending, QMI
- GOV.UK: UK bank holidays
Written by the CaptiFi Connect team. Published 22 October 2026. More in By the numbers
Send your first text this week
Set up your account and contacts now. Until we've approved it, a person reads each text before it goes out.